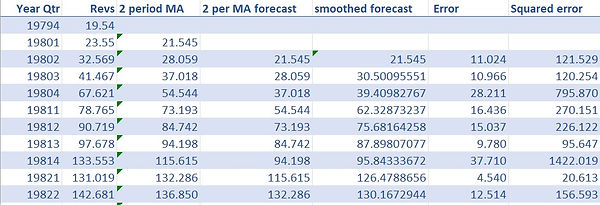
Here is a sample of the dataset, there are 104 entries or “trends” each with a recorded revenue they brought in and the year and quarter in which they brought in that revenue. For example, line one reads 1974, Quarter 4, rev of $19.54.
I computed a 2-quarter moving average (MA) forecast of Apple revenues which predicts one quarter ahead. Using the 2 period MA, I then computed an exponentially smoothed forecast.

This graph shows the actual revenues and the one step forecasts from the MA and the exponentially smoothed model. This model seems to be fairly accurate at predicting Apple revenues, however; the sum of squared errors on this model is 6768526.14 and I wanted to see if I could develop a model that would do a do a better/ more accurate job at predicting revenues.
So, I computed a one step ahead forecast of the Apple revenue data using a dynamic level, trend and seasonality model solving for parameters that minimized my sum of squared error variable. Here I was able to get a slightly more accurate model with a sum or squared errors (squared in order to take into account over and under prediction) of 5740486.12. Again, for my formulas and exact explanations, feel free to contact me.

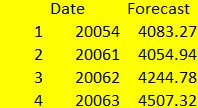
I was even able to use this model to predict revenues for the next 4 quarters!